| line |
stmt |
bran |
cond |
sub |
pod |
time |
code |
|
1
|
|
|
|
|
|
|
package Chart::Dygraphs; |
|
2
|
|
|
|
|
|
|
|
|
3
|
1
|
|
|
1
|
|
82507
|
use strict; |
|
|
1
|
|
|
|
|
2
|
|
|
|
1
|
|
|
|
|
36
|
|
|
4
|
1
|
|
|
1
|
|
5
|
use warnings; |
|
|
1
|
|
|
|
|
2
|
|
|
|
1
|
|
|
|
|
35
|
|
|
5
|
1
|
|
|
1
|
|
3
|
use utf8; |
|
|
1
|
|
|
|
|
5
|
|
|
|
1
|
|
|
|
|
5
|
|
|
6
|
|
|
|
|
|
|
|
|
7
|
1
|
|
|
1
|
|
17
|
use Exporter 'import'; |
|
|
1
|
|
|
|
|
1
|
|
|
|
1
|
|
|
|
|
50
|
|
|
8
|
|
|
|
|
|
|
our @EXPORT_OK = qw(show_plot); |
|
9
|
|
|
|
|
|
|
|
|
10
|
1
|
|
|
1
|
|
726
|
use JSON; |
|
|
1
|
|
|
|
|
13605
|
|
|
|
1
|
|
|
|
|
4
|
|
|
11
|
1
|
|
|
1
|
|
764
|
use Params::Validate qw(:all); |
|
|
1
|
|
|
|
|
7810
|
|
|
|
1
|
|
|
|
|
173
|
|
|
12
|
1
|
|
|
1
|
|
794
|
use Text::Template; |
|
|
1
|
|
|
|
|
2739
|
|
|
|
1
|
|
|
|
|
53
|
|
|
13
|
1
|
|
|
1
|
|
548
|
use HTML::Show; |
|
|
1
|
|
|
|
|
12603
|
|
|
|
1
|
|
|
|
|
27
|
|
|
14
|
1
|
|
|
1
|
|
470
|
use Ref::Util; |
|
|
1
|
|
|
|
|
659
|
|
|
|
1
|
|
|
|
|
627
|
|
|
15
|
|
|
|
|
|
|
|
|
16
|
|
|
|
|
|
|
our $VERSION = '0.007'; # VERSION |
|
17
|
|
|
|
|
|
|
|
|
18
|
|
|
|
|
|
|
# ABSTRACT: Generate html/javascript charts from perl data using javascript library Dygraphs |
|
19
|
|
|
|
|
|
|
|
|
20
|
|
|
|
|
|
|
sub render_full_html { |
|
21
|
0
|
|
|
0
|
1
|
|
my %params = validate( @_, |
|
22
|
|
|
|
|
|
|
{ data => { type => SCALAR | ARRAYREF | OBJECT }, |
|
23
|
|
|
|
|
|
|
options => { type => HASHREF, default => { showRangeSelector => 1 } }, |
|
24
|
|
|
|
|
|
|
render_html_options => { type => HASHREF, |
|
25
|
|
|
|
|
|
|
optional => 1, |
|
26
|
|
|
|
|
|
|
default => {} |
|
27
|
|
|
|
|
|
|
} |
|
28
|
|
|
|
|
|
|
} |
|
29
|
|
|
|
|
|
|
); |
|
30
|
|
|
|
|
|
|
return _render_html_wrap( |
|
31
|
0
|
|
|
|
|
|
_render_cell( _process_data_and_options( @params{qw(data options)} ), $params{'render_html_options'}, '' ) ); |
|
32
|
|
|
|
|
|
|
} |
|
33
|
|
|
|
|
|
|
|
|
34
|
|
|
|
|
|
|
sub _transform_data { |
|
35
|
0
|
|
|
0
|
|
|
my $data = shift; |
|
36
|
0
|
|
|
|
|
|
my $string_data = ""; |
|
37
|
0
|
0
|
0
|
|
|
|
if ( Ref::Util::is_plain_arrayref($data) ) { |
|
|
|
0
|
|
|
|
|
|
|
|
|
0
|
|
|
|
|
|
|
38
|
0
|
|
|
|
|
|
$string_data .= "[" . ( join( ',', map { _transform_data($_) } @$data ) ) . "]"; |
|
|
0
|
|
|
|
|
|
|
|
39
|
|
|
|
|
|
|
} elsif ( Ref::Util::is_plain_hashref($data) ) { |
|
40
|
0
|
|
|
|
|
|
return "not supported"; |
|
41
|
|
|
|
|
|
|
} elsif ( Ref::Util::is_blessed_ref($data) && $data->isa('DateTime') ) { |
|
42
|
0
|
|
|
|
|
|
return 'new Date("' . $data . '")'; |
|
43
|
|
|
|
|
|
|
} else { |
|
44
|
0
|
|
|
|
|
|
return $data; |
|
45
|
|
|
|
|
|
|
} |
|
46
|
0
|
|
|
|
|
|
return $string_data; |
|
47
|
|
|
|
|
|
|
} |
|
48
|
|
|
|
|
|
|
|
|
49
|
|
|
|
|
|
|
sub _process_data_and_options { |
|
50
|
0
|
|
|
0
|
|
|
my $data = shift(); |
|
51
|
0
|
|
|
|
|
|
my $options = shift(); |
|
52
|
0
|
|
|
|
|
|
my $json_formatter = JSON->new->utf8; |
|
53
|
0
|
|
|
0
|
|
|
local *PDL::TO_JSON = sub { $_[0]->unpdl }; |
|
|
0
|
|
|
|
|
|
|
|
54
|
0
|
0
|
|
|
|
|
if ( Ref::Util::is_blessed_ref($data) ) { |
|
55
|
0
|
|
|
|
|
|
my $adapter_name = 'Chart::Dygraphs::Adapter::' . ref $data; |
|
56
|
0
|
|
|
|
|
|
eval { |
|
57
|
0
|
|
|
|
|
|
load $adapter_name; |
|
58
|
0
|
|
|
|
|
|
my $adapter = $adapter_name->new( data => $data ); |
|
59
|
0
|
|
|
|
|
|
$data = $adapter->series(); |
|
60
|
|
|
|
|
|
|
}; |
|
61
|
0
|
0
|
|
|
|
|
if ($@) { |
|
62
|
0
|
|
|
|
|
|
warn 'Cannot load adapter: ' . $adapter_name . '. ' . $@; |
|
63
|
|
|
|
|
|
|
} |
|
64
|
|
|
|
|
|
|
} |
|
65
|
0
|
|
|
|
|
|
return join( ',', _transform_data($data), $json_formatter->encode($options) ); |
|
66
|
|
|
|
|
|
|
} |
|
67
|
|
|
|
|
|
|
|
|
68
|
|
|
|
|
|
|
sub _render_cell { |
|
69
|
|
|
|
|
|
|
|
|
70
|
0
|
|
|
0
|
|
|
my $data = shift(); |
|
71
|
0
|
|
|
|
|
|
my $html_options = shift(); |
|
72
|
0
|
|
|
|
|
|
my $id = shift(); |
|
73
|
0
|
|
|
|
|
|
my $template = <<'TEMPLATE'; |
|
74
|
|
|
|
|
|
|
{$pre_graph_html} |
|
75
|
|
|
|
|
|
|
<div id="{$dygraphs_div_id}" style="{$dygraphs_div_inline_style}"></div> |
|
76
|
|
|
|
|
|
|
<script type="text/javascript"> |
|
77
|
|
|
|
|
|
|
{$dygraphs_javascript_object_name} = new Dygraph( |
|
78
|
|
|
|
|
|
|
document.getElementById("{$dygraphs_div_id}"), |
|
79
|
|
|
|
|
|
|
{$data_and_options} |
|
80
|
|
|
|
|
|
|
); |
|
81
|
|
|
|
|
|
|
|
|
82
|
|
|
|
|
|
|
var range = {$dygraphs_javascript_object_name}.yAxisRange(0); |
|
83
|
|
|
|
|
|
|
{$dygraphs_javascript_object_name}.updateOptions(\{valueRange: range\}); |
|
84
|
|
|
|
|
|
|
</script> |
|
85
|
|
|
|
|
|
|
{$post_graph_html} |
|
86
|
|
|
|
|
|
|
TEMPLATE |
|
87
|
0
|
|
|
|
|
|
my $template_variables = { %{$html_options}, data_and_options => $data, }; |
|
|
0
|
|
|
|
|
|
|
|
88
|
|
|
|
|
|
|
|
|
89
|
0
|
0
|
|
|
|
|
if ( !defined $template_variables->{'dygraphs_div_id'} ) { |
|
90
|
0
|
|
|
|
|
|
$template_variables->{'dygraphs_div_id'} = 'graphdiv' . $id; |
|
91
|
|
|
|
|
|
|
} |
|
92
|
0
|
0
|
|
|
|
|
if ( !defined $template_variables->{'dygraphs_javascript_object_name'} ) { |
|
93
|
0
|
|
|
|
|
|
$template_variables->{'dygraphs_javascript_object_name'} = 'g' . $id; |
|
94
|
|
|
|
|
|
|
} |
|
95
|
0
|
0
|
|
|
|
|
if ( !defined $template_variables->{'dygraphs_div_inline_style'} ) { |
|
96
|
0
|
|
|
|
|
|
$template_variables->{'dygraphs_div_inline_style'} = 'width: 100%'; |
|
97
|
|
|
|
|
|
|
} |
|
98
|
0
|
|
|
|
|
|
my $renderer = Text::Template->new( TYPE => 'STRING', SOURCE => $template ); |
|
99
|
0
|
|
|
|
|
|
return $renderer->fill_in( HASH => $template_variables ); |
|
100
|
|
|
|
|
|
|
} |
|
101
|
|
|
|
|
|
|
|
|
102
|
|
|
|
|
|
|
sub _render_html_wrap { |
|
103
|
0
|
|
|
0
|
|
|
my $body = shift(); |
|
104
|
|
|
|
|
|
|
|
|
105
|
0
|
|
|
|
|
|
my $html_begin = <<'BEGIN_HTML'; |
|
106
|
|
|
|
|
|
|
<html> |
|
107
|
|
|
|
|
|
|
<head> |
|
108
|
|
|
|
|
|
|
<script src="https://cdnjs.cloudflare.com/ajax/libs/dygraph/1.1.1/dygraph-combined.js"></script> |
|
109
|
|
|
|
|
|
|
</head> |
|
110
|
|
|
|
|
|
|
<body> |
|
111
|
|
|
|
|
|
|
BEGIN_HTML |
|
112
|
|
|
|
|
|
|
|
|
113
|
0
|
|
|
|
|
|
my $html_end = <<'END_HTML'; |
|
114
|
|
|
|
|
|
|
</body> |
|
115
|
|
|
|
|
|
|
</html> |
|
116
|
|
|
|
|
|
|
END_HTML |
|
117
|
|
|
|
|
|
|
|
|
118
|
0
|
|
|
|
|
|
return $html_begin . $body . $html_end; |
|
119
|
|
|
|
|
|
|
|
|
120
|
|
|
|
|
|
|
} |
|
121
|
|
|
|
|
|
|
|
|
122
|
|
|
|
|
|
|
sub show_plot { |
|
123
|
0
|
|
|
0
|
1
|
|
my @data_to_plot = @_; |
|
124
|
|
|
|
|
|
|
|
|
125
|
0
|
|
|
|
|
|
my $rendered_cells = ""; |
|
126
|
0
|
|
|
|
|
|
my $numeric_id = 0; |
|
127
|
0
|
|
|
|
|
|
for my $data (@data_to_plot) { |
|
128
|
0
|
0
|
|
|
|
|
if ( ref $data eq 'Chart::Dygraphs::Plot' ) { |
|
129
|
0
|
|
|
|
|
|
$rendered_cells .= _render_cell( _process_data_and_options( $data->data, $data->options ), |
|
130
|
|
|
|
|
|
|
{ dygraphs_div_id => 'graphdiv' . $numeric_id, |
|
131
|
|
|
|
|
|
|
dygraphs_javascript_object_name => 'g' . $numeric_id |
|
132
|
|
|
|
|
|
|
}, |
|
133
|
|
|
|
|
|
|
'chart_' . $numeric_id++ |
|
134
|
|
|
|
|
|
|
); |
|
135
|
|
|
|
|
|
|
|
|
136
|
|
|
|
|
|
|
} else { |
|
137
|
0
|
|
|
|
|
|
$rendered_cells .= _render_cell( _process_data_and_options( $data, { showRangeSelector => 1 } ), |
|
138
|
|
|
|
|
|
|
{ dygraphs_div_id => 'graphdiv' . $numeric_id, |
|
139
|
|
|
|
|
|
|
dygraphs_javascript_object_name => 'g' . $numeric_id |
|
140
|
|
|
|
|
|
|
}, |
|
141
|
|
|
|
|
|
|
'chart_' . $numeric_id++ |
|
142
|
|
|
|
|
|
|
); |
|
143
|
|
|
|
|
|
|
} |
|
144
|
|
|
|
|
|
|
} |
|
145
|
0
|
|
|
|
|
|
my $plots = _render_html_wrap($rendered_cells); |
|
146
|
0
|
|
|
|
|
|
HTML::Show::show($plots); |
|
147
|
|
|
|
|
|
|
} |
|
148
|
|
|
|
|
|
|
|
|
149
|
|
|
|
|
|
|
1; |
|
150
|
|
|
|
|
|
|
|
|
151
|
|
|
|
|
|
|
__END__ |
|
152
|
|
|
|
|
|
|
|
|
153
|
|
|
|
|
|
|
=pod |
|
154
|
|
|
|
|
|
|
|
|
155
|
|
|
|
|
|
|
=encoding utf-8 |
|
156
|
|
|
|
|
|
|
|
|
157
|
|
|
|
|
|
|
=head1 NAME |
|
158
|
|
|
|
|
|
|
|
|
159
|
|
|
|
|
|
|
Chart::Dygraphs - Generate html/javascript charts from perl data using javascript library Dygraphs |
|
160
|
|
|
|
|
|
|
|
|
161
|
|
|
|
|
|
|
=head1 VERSION |
|
162
|
|
|
|
|
|
|
|
|
163
|
|
|
|
|
|
|
version 0.007 |
|
164
|
|
|
|
|
|
|
|
|
165
|
|
|
|
|
|
|
=head1 SYNOPSIS |
|
166
|
|
|
|
|
|
|
|
|
167
|
|
|
|
|
|
|
use Chart::Dygraphs qw(show_plot); |
|
168
|
|
|
|
|
|
|
|
|
169
|
|
|
|
|
|
|
my $data = [map {[$_, rand($_)]} 1..10 ]; |
|
170
|
|
|
|
|
|
|
show_plot($data); |
|
171
|
|
|
|
|
|
|
|
|
172
|
|
|
|
|
|
|
use Chart::Dygraphs qw(show_plot); |
|
173
|
|
|
|
|
|
|
use DateTime; |
|
174
|
|
|
|
|
|
|
|
|
175
|
|
|
|
|
|
|
my $start_date = DateTime->now(time_zone => 'UTC')->truncate(to => 'hour'); |
|
176
|
|
|
|
|
|
|
my $time_series_data = [map {[$start_date->add(hours => 1)->clone(), rand($_)]} 1..1000]; |
|
177
|
|
|
|
|
|
|
|
|
178
|
|
|
|
|
|
|
show_plot($time_series_data); |
|
179
|
|
|
|
|
|
|
|
|
180
|
|
|
|
|
|
|
=head1 DESCRIPTION |
|
181
|
|
|
|
|
|
|
|
|
182
|
|
|
|
|
|
|
Generate html/javascript charts from perl data using javascript library Dygraphs. The result |
|
183
|
|
|
|
|
|
|
is html that you could see in your favourite browser. |
|
184
|
|
|
|
|
|
|
|
|
185
|
|
|
|
|
|
|
Example screenshot of plot generated with examples/time_series.pl: |
|
186
|
|
|
|
|
|
|
|
|
187
|
|
|
|
|
|
|
=for HTML <p> |
|
188
|
|
|
|
|
|
|
<img src="https://raw.githubusercontent.com/pablrod/p5-Chart-Dygraphs/master/examples/time_series.png" alt="Random time series plotted with Dygraphs"> |
|
189
|
|
|
|
|
|
|
</p> |
|
190
|
|
|
|
|
|
|
|
|
191
|
|
|
|
|
|
|
=for markdown 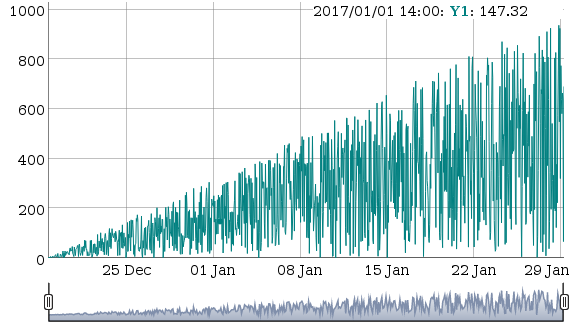 |
|
192
|
|
|
|
|
|
|
|
|
193
|
|
|
|
|
|
|
The API is subject to changes. |
|
194
|
|
|
|
|
|
|
|
|
195
|
|
|
|
|
|
|
=head1 FUNCTIONS |
|
196
|
|
|
|
|
|
|
|
|
197
|
|
|
|
|
|
|
=head2 render_full_html |
|
198
|
|
|
|
|
|
|
|
|
199
|
|
|
|
|
|
|
=head3 Parameters |
|
200
|
|
|
|
|
|
|
|
|
201
|
|
|
|
|
|
|
=over |
|
202
|
|
|
|
|
|
|
|
|
203
|
|
|
|
|
|
|
=item * data: |
|
204
|
|
|
|
|
|
|
|
|
205
|
|
|
|
|
|
|
Data to be represented. The format is the perl version of the data expected by Dygraphs: L<http://dygraphs.com/data.html> |
|
206
|
|
|
|
|
|
|
|
|
207
|
|
|
|
|
|
|
=item * options: |
|
208
|
|
|
|
|
|
|
|
|
209
|
|
|
|
|
|
|
Hashref with options for graph. The format is the perl version of the options expected by Dygraphs: L<http://dygraphs.com/options.html> |
|
210
|
|
|
|
|
|
|
Optional |
|
211
|
|
|
|
|
|
|
|
|
212
|
|
|
|
|
|
|
=item * render_html_options |
|
213
|
|
|
|
|
|
|
|
|
214
|
|
|
|
|
|
|
Hashref with options controlling html output. With this you can inject html, javascript or styles. |
|
215
|
|
|
|
|
|
|
|
|
216
|
|
|
|
|
|
|
Supported options: |
|
217
|
|
|
|
|
|
|
|
|
218
|
|
|
|
|
|
|
=over |
|
219
|
|
|
|
|
|
|
|
|
220
|
|
|
|
|
|
|
=item * pre_graph_html |
|
221
|
|
|
|
|
|
|
|
|
222
|
|
|
|
|
|
|
=item * post_graph_html |
|
223
|
|
|
|
|
|
|
|
|
224
|
|
|
|
|
|
|
=item * dygraphs_div_id |
|
225
|
|
|
|
|
|
|
|
|
226
|
|
|
|
|
|
|
=item * dygraphs_javascript_object_name |
|
227
|
|
|
|
|
|
|
|
|
228
|
|
|
|
|
|
|
=item * dygraphs_div_inline_style |
|
229
|
|
|
|
|
|
|
|
|
230
|
|
|
|
|
|
|
=back |
|
231
|
|
|
|
|
|
|
|
|
232
|
|
|
|
|
|
|
=back |
|
233
|
|
|
|
|
|
|
|
|
234
|
|
|
|
|
|
|
=head2 show_plot |
|
235
|
|
|
|
|
|
|
|
|
236
|
|
|
|
|
|
|
Opens the plot in a browser locally |
|
237
|
|
|
|
|
|
|
|
|
238
|
|
|
|
|
|
|
=head3 Parameters |
|
239
|
|
|
|
|
|
|
|
|
240
|
|
|
|
|
|
|
Data to be represented. The format is the same as the parameter data in render_full_html |
|
241
|
|
|
|
|
|
|
|
|
242
|
|
|
|
|
|
|
=head1 AUTHOR |
|
243
|
|
|
|
|
|
|
|
|
244
|
|
|
|
|
|
|
Pablo RodrÃguez González |
|
245
|
|
|
|
|
|
|
|
|
246
|
|
|
|
|
|
|
=head1 BUGS |
|
247
|
|
|
|
|
|
|
|
|
248
|
|
|
|
|
|
|
Please report any bugs or feature requests via github: L<https://github.com/pablrod/p5-Chart-Dygraphs/issues> |
|
249
|
|
|
|
|
|
|
|
|
250
|
|
|
|
|
|
|
=head1 LICENSE AND COPYRIGHT |
|
251
|
|
|
|
|
|
|
|
|
252
|
|
|
|
|
|
|
Copyright 2016 Pablo RodrÃguez González. |
|
253
|
|
|
|
|
|
|
|
|
254
|
|
|
|
|
|
|
This program is free software; you can redistribute it and/or modify it |
|
255
|
|
|
|
|
|
|
under the terms of the the Artistic License (2.0). You may obtain a |
|
256
|
|
|
|
|
|
|
copy of the full license at: |
|
257
|
|
|
|
|
|
|
|
|
258
|
|
|
|
|
|
|
L<http://www.perlfoundation.org/artistic_license_2_0> |
|
259
|
|
|
|
|
|
|
|
|
260
|
|
|
|
|
|
|
Any use, modification, and distribution of the Standard or Modified |
|
261
|
|
|
|
|
|
|
Versions is governed by this Artistic License. By using, modifying or |
|
262
|
|
|
|
|
|
|
distributing the Package, you accept this license. Do not use, modify, |
|
263
|
|
|
|
|
|
|
or distribute the Package, if you do not accept this license. |
|
264
|
|
|
|
|
|
|
|
|
265
|
|
|
|
|
|
|
If your Modified Version has been derived from a Modified Version made |
|
266
|
|
|
|
|
|
|
by someone other than you, you are nevertheless required to ensure that |
|
267
|
|
|
|
|
|
|
your Modified Version complies with the requirements of this license. |
|
268
|
|
|
|
|
|
|
|
|
269
|
|
|
|
|
|
|
This license does not grant you the right to use any trademark, service |
|
270
|
|
|
|
|
|
|
mark, tradename, or logo of the Copyright Holder. |
|
271
|
|
|
|
|
|
|
|
|
272
|
|
|
|
|
|
|
This license includes the non-exclusive, worldwide, free-of-charge |
|
273
|
|
|
|
|
|
|
patent license to make, have made, use, offer to sell, sell, import and |
|
274
|
|
|
|
|
|
|
otherwise transfer the Package with respect to any patent claims |
|
275
|
|
|
|
|
|
|
licensable by the Copyright Holder that are necessarily infringed by the |
|
276
|
|
|
|
|
|
|
Package. If you institute patent litigation (including a cross-claim or |
|
277
|
|
|
|
|
|
|
counterclaim) against any party alleging that the Package constitutes |
|
278
|
|
|
|
|
|
|
direct or contributory patent infringement, then this Artistic License |
|
279
|
|
|
|
|
|
|
to you shall terminate on the date that such litigation is filed. |
|
280
|
|
|
|
|
|
|
|
|
281
|
|
|
|
|
|
|
Disclaimer of Warranty: THE PACKAGE IS PROVIDED BY THE COPYRIGHT HOLDER |
|
282
|
|
|
|
|
|
|
AND CONTRIBUTORS "AS IS' AND WITHOUT ANY EXPRESS OR IMPLIED WARRANTIES . THE IMPLIED WARRANTIES OF MERCHANTABILITY, |
|
283
|
|
|
|
|
|
|
FITNESS FOR A PARTICULAR |
|
284
|
|
|
|
|
|
|
PURPOSE, OR NON-INFRINGEMENT ARE DISCLAIMED TO THE EXTENT PERMITTED BY |
|
285
|
|
|
|
|
|
|
YOUR LOCAL LAW . UNLESS REQUIRED BY LAW, NO COPYRIGHT HOLDER OR |
|
286
|
|
|
|
|
|
|
CONTRIBUTOR WILL BE LIABLE FOR ANY DIRECT, INDIRECT, INCIDENTAL, OR |
|
287
|
|
|
|
|
|
|
CONSEQUENTIAL DAMAGES ARISING IN ANY WAY OUT OF THE USE OF THE PACKAGE, |
|
288
|
|
|
|
|
|
|
EVEN IF ADVISED OF THE POSSIBILITY OF SUCH DAMAGE |
|
289
|
|
|
|
|
|
|
. |
|
290
|
|
|
|
|
|
|
|
|
291
|
|
|
|
|
|
|
=head1 AUTHOR |
|
292
|
|
|
|
|
|
|
|
|
293
|
|
|
|
|
|
|
Pablo RodrÃguez González <pablo.rodriguez.gonzalez@gmail.com> |
|
294
|
|
|
|
|
|
|
|
|
295
|
|
|
|
|
|
|
=head1 COPYRIGHT AND LICENSE |
|
296
|
|
|
|
|
|
|
|
|
297
|
|
|
|
|
|
|
This software is copyright (c) 2016 by Pablo RodrÃguez González. |
|
298
|
|
|
|
|
|
|
|
|
299
|
|
|
|
|
|
|
This is free software; you can redistribute it and/or modify it under |
|
300
|
|
|
|
|
|
|
the same terms as the Perl 5 programming language system itself. |
|
301
|
|
|
|
|
|
|
|
|
302
|
|
|
|
|
|
|
=cut |